The leading knowledge exchange for Data Center, IT and Mission Critical professionals.

By Jorge A. Gil, DCEP
1. THE DESIGN PUE CURVE IS ALL ABOUT THE SITE INFRASTRUCTURE LEVEL OF EFFICIENCY AND IT UTILIZATION.
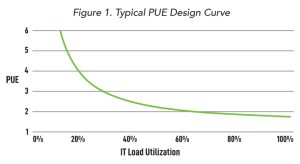
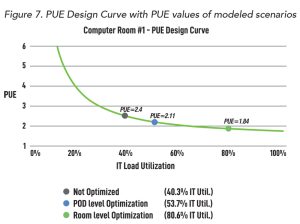
Every data center facility has a design PUE curve, sometimes implicit, so the owners and operators might not be aware of that. This curve is basically the result of the data center’s designed level of energy efficiency as the function of the IT Load utilization. So, the design PUE value is obtained at 100% of IT load utilization. In figure 1, there is an example of a design PUE curve.
Understanding the correlation between the PUE value and IT load utilization is an important take, since once the data center is in the operational stage, there might be very few things to do in order to improve its efficiency, without retrofitting the site. So, trying to improve the IT Load utilization might sound like the logical first step before getting into the site infrastructure side. By optimizing the IT load first, we can look for a better adjustment of the site infrastructure optimization later, getting the best possible efficiency scenario.
The IT room utilization (ITRU) set of metrics, can effectively be used in assessing the current state of the IT Load utilization and room occupancy, of any data center implemented with Racks (EIA-310-D and/or OCP Racks).
The IT room utilization (ITRU) method, is a way to assess the maximum potential utilization of the IT load, by modeling and projecting the consolidation of IT equipment into fewer Racks, and deactivating the empty racks and its collateral site infrastructure.
The interesting side about the ITRU method is that it helps in projecting improvement scenarios with few input data collected from the data and Telco room, producing key information about the current state of the overall room efficiency and the future potential optimization.
2. HOW CONTROLLING THE IT SPACE CAN IMPROVE THE IT LOAD UTILIZATION
The IT Room Utilization (ITRU) proposes a way to measure the IT Load utilization in a standardized way, as in the equation:
ITRU = Average Used IT Load / Design IT Load
Where the design IT load, is obtained by the summation of total rack capacity (typically in kW) in the computer/Telco room. The average used IT load will be the average power consumption by IT equipment in the computer/Telco room.
As IT equipment are usually arranged in racks, having a standard way to measure the total room occupancy with respect to its functional approach (Rack Units), is key in order to be able to improve its efficiency.
Rack usage ratio (RUR) is a way to measure the occupancy of the computer/Telco room capacity, in terms of the IT equipment functional space (rack units or open units). As site infrastructure components capacity are directly dependent of the IT racks power capacity (aka rack power density), the reduction of IT racks might directly impact site infrastructure components. However, the amount of site infrastructure equipment to be impacted will depend on the way the computer room is designed. Highly modularized computer room architectures will be more impacted than less modularized ones. Understanding the relation between the site infrastructure components and the IT racks, is an important take in order to understand how efficient a data center might operate.
In addition to rack occupancy (RUR), it’s also important to know what the average rack power density usage is, also according to its functional space (rack units or open units), and the resulting indicator called rack power ratio (RPR), was designed to address that need.
Rack power ratio (RPR), is an important metric, since it allows you to determine:
Finally, as RPR and RUR are related to rack units, ITRU alternative equation can be used to project potential IT load
utilization scenarios (ITRU alternative method).
ITRU = RPR * RUR
Summary of ITRU Set of Metrics.

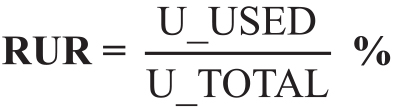
Where:
U_USED is the total of units (Rack Units or Open Units) occupied with IT equipment. U_TOTAL is the total of units (rack units or open units) available for IT equipment (occupied units + empty units).

RPR metric and potential ITRU (potential IT load utilization).
The RPR (Rack Power Ratio), helps in projecting the potential ITRU improvement, after consolidating the rack space.
The RPR will be the maximum theoretical ITRU value (utilization) to be obtained, by consolidating the IT equipment at 100% of rack occupancy: Potential ITRU max = RPR x 100%.
However, the real Potential ITRU, for any assessed data room can be obtained by the following equation:
POTENTIAL ITRU = RPR * POTENTIAL RUR
The potential RUR (rack usage ratio), will be obtained after dividing the total used rack Units (used by IT equipment) by the resulted value of multiplying the racks needed by racks units per rack (If RPR <= 100%).
Projecting the racks needed is critical, since it’s the basis for rack consolidation. After calculating the racks needed, the remaining Racks can be effectively deactivated, potentially impacting the correlated site infrastructure.
The RPR indicator can also be used to determine if there is overload at rack unit level (RPR > 100%). In that case, it helps during the rack consolidation process by preventing the overload at rack level (avoiding a safety issue).
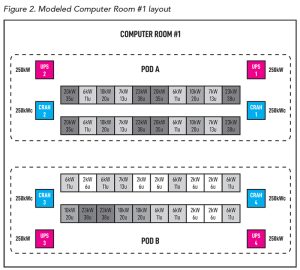
Modeled Computer Room
Figure 2 shows a modeled computer room, with site infrastructure components (UPS/CRAH), with two PODs (point of Delivery) with identical distribution. IT racks shown both have different levels of occupancy and average power consumption.
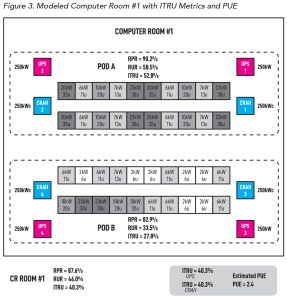
Modeled Computer Room #1 data:
The original ROOM level ITRU=40.3% (low utilization) and RUR=46.8% (low occupancy), initially shows a poor performance scenario. The PUE=2.4 can be easily explained since the utilization (ITRU) is at 40.3% for site infrastructure components (UPS/CRAH) (Potential ITRUsi_comp=40.3%).
The estimated ROOM level RPR=87.6%, gives an initial indication of potential IT load utilization improvement, if IT equipment are theoretically rearrange at 100% occupancy. The current state of the computer Room #1 ITRU metrics, are shown in Figure 3.
After executing the ITRU assessment method, the ROOM potential ITRU=84.8% could be obtained, by consolidating the IT racks at potential RUR=96.8% (Occupancy ratio). By deactivating the IT racks left empty, the consolidated IT racks has a “new design IT load”=475kW (19 Racks x 25kW/Rack). The resulted values of the ITRU metrics at ROOM level are the same for any scenario, however the impact to site infrastructure components will vary depending of the optimization approach to be implemented. As the computer room #1 is arranged with 2 PODs, there would be two potential scenarios:
POD Level Optimization
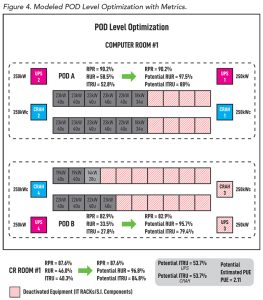
This scenario was considered in case of having different owners for each POD. In that case, the analysis for potential improvement has to be done independently. Figure 4 shows the modeled POD level optimization with metrics.
The current state of the POD A shows a better IT load utilization, compared with the POD B (POD A ITRU=52.8% vs POD B ITRU=27.8%). The potential utilization of the POD A is also better compared with the POD B (POD A Potential ITRU=88% Vs POD B Potential ITRU=79%). However, since every POD was designed with 2 site infrastructure components for both UPS and cooling equipment (10 Racks per SI Component), POD A has to operate at its full capacity (SI Components) after potentially consolidating the IT racks. On the other hand, site infrastructure components for POD B, could be potentially deactivated to its half, after consolidating the IT racks. The overall gain would be an improvement to potential ITRUsi_comp=53.7%, with an estimated PUE=2.11.
ROOM Level Optimization
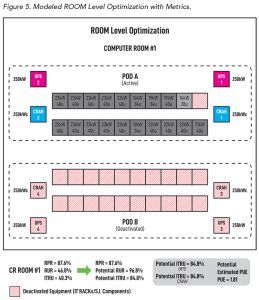
The room level optimization scenario, shown in figure 5, would be the best possible scenario, since it allows for deactivating greater amount of site infrastructure components correlated to the Racks left empty, after the potential consolidation process.
The overall improvement of potential ITRUsi_comp=80.6%, approaching to the potential ITRU=84.8% of the room, can be achieved thanks to the complete deactivation of one of the PODs, reducing the PUE to 1.84 (Estimated Value).
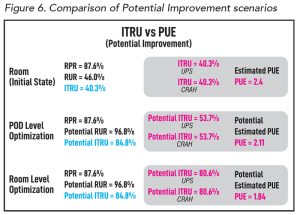
Figure 6 shows the comparison of each scenario using the ITRU metrics and PUE, demonstrating the effectiveness of the ITRU metrics to assess the current state with potential improvement scenarios. As the ITRU (IT Room Utilization) is a relation of total rack capacity usage, it is important to compare the IT load utilization of each site infrastructure component (Potential ITRUsi_comp), in order to project the impact to PUE.
The following equation for potential ITRUsi_comp could be used in order to estimate the total utilization of any type of site infrastructure component, with respect to the IT load:
3. CONCLUSIONS
The ITRU method and set of metrics are designed to measure the rack occupancy of the computer/Telco room, in order to assess both the potential improvement of the IT load utilization and the potential improvement of the energy efficiency at facility level.
As estimating the PUE usually requires CFD software or similar tools, the ITRU metrics can be used independently to demonstrate the potential improvement of the computer room, and its impact to site infrastructure components in a simple manner.
Jorge A. Gil, DCEP is Principal at SERES, LLC. He can be reached at [email protected].